
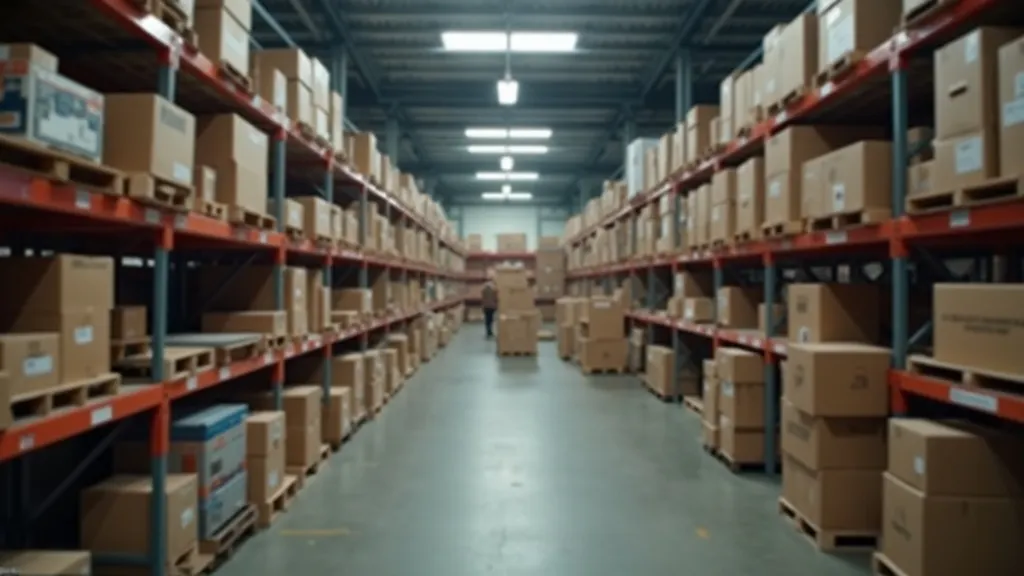
Retouren na de Feestdagen: De Tweede Piekperiode die de Meeste E-Commerce Merken Nog Steeds Niet Plannen
Retouren na de Feestdagen: De Tweede Piekperiode die de Meeste E-Commerce Merken Nog Steeds Niet Plannen
Elke logistiek verantwoordelijke in de Europese e-commerce weet hoe het vierde kwartaal eruitziet. Magazijnteams schalen op, vervoerderscontracten worden heronderhandeld en marketingkalenders worden gebouwd rond Black Friday en de decemberdrukte. Veel minder teams bouwen datzelfde niveau van voorbereiding voor wat daarna komt: de retourgolf die op elk feestdagenseizoen volgt, en die de volumes waar hij op reageert regelmatig overtreft.
Cijfers van de National Retail Federation laten zien dat het gemiddelde online retourpercentage voor 2025 rond de 19 procent lag, en retouren tijdens het feestdagenseizoen liggen doorgaans ruim boven die basislijn. Meerdere onderzoeken onder vervoerders en logistieke partijen melden dat het retourpercentage in de weken direct na december oploopt naar 40 tot 50 procent, meer dan het dubbele van wat de meeste operationele teams begroten. Dat verschil tussen wat het management verwacht en wat er daadwerkelijk in de retourstroom belandt, maakt van januari in stilte de op een na drukste en duurste periode van het jaar.
Bij Zineps werken we dagelijks met e-commerce merken die door heel Europa verzenden, en het patroon is consistent. Teams plannen tot in detail voor uitgaand piekvolume. Bijna niemand bouwt dezelfde discipline in voor inkomend piekvolume. Die asymmetrie is de belangrijkste reden waarom het retourseizoen een brandje blussen wordt in plaats van een voorspelde gebeurtenis.
Waarom de Januaripiek Ook Ervaren Teams Verrast
Drie structurele oorzaken verklaren waarom retouren na de feestdagen operators blijven verrassen die verder een strakke logistieke operatie runnen.
Cadeaus Gedragen Zich Anders Dan Gewone Bestellingen
Een groot deel van het decembervolume betreft cadeaus in plaats van zelf gekochte artikelen. Ontvangers van een cadeau hebben de maat, kleur of het product zelf niet gekozen, wat de kans op retour flink verhoogt vergeleken met een gewone transactie. Verlengde retourtermijnen tijdens de feestdagen, vaak 60 of 90 dagen in plaats van de gebruikelijke 14 of 30, zorgen ervoor dat dit volume niet in een week landt. Het komt in golven binnen door januari en februari heen, wat personeelsplanning en capaciteitsplanning lastiger maakt dan een enkele scherpe piek zou doen.
Finance en Operations Plannen op Verschillende Kalenders
Retouren zijn tegelijk een logistiek vraagstuk, een klantenservicevraagstuk en een financieel vraagstuk. In de meeste organisaties voorspellen deze drie functies onafhankelijk van elkaar. Operations plant magazijnbezetting op basis van uitgaand verzendvolume. Finance sluit het boekjaar af en boekt verwachte omzet voordat de retourgolf goed en wel is begonnen. Tegen de tijd dat de terugbetalingsverplichtingen op de balans van februari verschijnen, zijn de operationele beslissingen die dit hadden kunnen beperken al maanden eerder genomen, of helemaal niet genomen.
Geretourneerde Voorraad Kent een Verborgen Tijdskost
Een geretourneerd artikel is niet meteen weer verkoopbare voorraad. Het moet terugreizen naar een magazijn, geïnspecteerd worden, opnieuw op voorraad gezet of afgeschreven worden, en vervolgens verwerkt worden in de beschikbare voorraad over alle verkoopkanalen heen. Afhankelijk van transporttijden en verwerkingscapaciteit van het magazijn duurt die cyclus vaak twee tot vier weken per artikel. Tijdens het drukste retourseizoen, wanneer het inkomend volume het hoogst is en het magazijnpersoneel het meest onder druk staat, wordt die cyclus nog langer, waardoor kapitaal vastzit in voorraad die op papier beschikbaar lijkt maar dat in werkelijkheid nog niet is.
Wat een Onvoorbereide Retourpiek Werkelijk Kost
De financiële blootstelling is groter dan de meeste financeteams modelleren. Neem een middelgroot e-commerce merk dat 10.000 bestellingen verzendt tijdens een feestdagenpiek, met een gemiddelde orderwaarde van 60 euro. Zelfs bij een conservatief retourpercentage van 30 procent na de feestdagen komen er 3.000 artikelen terug, goed voor 180.000 euro aan terugbetalingsverplichtingen die door de organisatie stromen binnen een kort tijdsbestek. Duw dat retourpercentage richting de 40 tot 50 procent die verschillende recente sectorrapporten voor januari aangeven, en het bedrag loopt op tot ruim boven de 250.000 euro bij hetzelfde ordervolume.
Dat bedrag omvat niet de bijkomende kosten: retourvrachtkosten, magazijnpersoneel voor inspectie en het opnieuw op voorraad zetten, klantenservicecapaciteit voor vragen over de status van retouren, en de opportuniteitskost van voorraad die vastzit in plaats van opnieuw verkocht te worden. Merken die retouren behandelen als een klantenserviceposten in plaats van een supply chain gebeurtenis onderschatten het totaal stelselmatig, omdat het grootste deel van de werkelijke kost buiten het klantenservicebudget valt.
Categorie speelt ook een rol. Kleding en schoenen, waar pasvorm en cadeaus het grootste deel van de aankopen bepalen, worden doorgaans twee tot drie keer zo vaak geretourneerd als elektronica of woonartikelen. Een merk dat in meerdere categorieën verkoopt, kan niet met één gemiddelde retouraanname werken en toch een nauwkeurige voorspelling verwachten; het model moet op categorieniveau gebouwd worden om bruikbaar te zijn.
Bouw het Retourdraaiboek Vóór de Drukte, Niet Tijdens
Merken die retouren na de feestdagen goed aanpakken, delen één kenmerk: ze bouwen het plan in de rustigere maanden, niet middenin de piek. Dit is het raamwerk dat we aanraden aan verladers op het Zineps platform.
1. Voorspel de Piek Los van het Uitgaande Volume
Voeg retourvoorspelling niet samen met de algemene piekseizoenplanning. Bouw een apart retourvolumemodel op basis van het historische retourpercentage per productcategorie, het aandeel cadeaubestellingen en de lengte van de retourtermijn. Een zomerjurk met een retourtermijn van 45 dagen gedraagt zich compleet anders dan een elektronica-accessoire met een termijn van 14 dagen, en de voorspelling moet die granulariteit weerspiegelen in plaats van één gemiddelde aanname.
2. Automatiseer Retourautorisatie en Vervoerdersroutering
Handmatige retourgoedkeuring is het grootste knelpunt zodra het volume toeneemt. Geautomatiseerde regels die eenvoudige retouren direct goedkeuren, het juiste label voor de juiste vervoerder genereren op basis van actuele tarief- en capaciteitsdata, en uitzonderingen alleen doorsturen naar een medewerker wanneer nodig, kunnen de verwerkingstijd terugbrengen van dagen naar minuten. Dit is precies de laag waarvoor Zineps is gebouwd: één verbonden overzicht over elke vervoerder en elke retour, in plaats van een lappendeken van vervoerdersportalen en spreadsheets.
3. Zet Terugbetalingen om in Winkeltegoed op het Beslismoment
Retailers die winkeltegoed actief aanbieden als standaardoptie bij een retour, in plaats van als verstopt alternatief, zien de conversie naar tegoed fors stijgen ten opzichte van retailers die dit niet actief tonen. Elke euro die winkeltegoed wordt in plaats van een contante terugbetaling, blijft in het bedrijf en wordt vaak besteed aan een tweede, extra bestelling. Dit inbouwen in de retourflow zelf, in plaats van als bijzaak in een supportticket, is een van de meest impactvolle aanpassingen die een e-commerce merk kan doen richting het retourseizoen.
4. Verwerk Geretourneerde Voorraad in Realtime
De kloof tussen fysiek geretourneerd en weer verkoopbaar is waar de voorraadnauwkeurigheid stilletjes afbrokkelt. Realtime afstemming tussen het retourproces en het voorraadsysteem dicht die kloof, zodat een geretourneerd artikel verkoopbare voorraad wordt zodra het de inspectie doorstaat, in plaats van wekenlang in een niet-afgestemde tussenstatus te blijven hangen.
5. Geef Finance en Operations een Gedeeld Overzicht
Het voorspellingsprobleem van eerder is in de kern een probleem van het niet delen van data. Wanneer operations, finance en klantenservice allemaal werken vanuit hetzelfde live retourdashboard in plaats van drie losse spreadsheets, worden terugbetalingsverplichtingen, voorraadimpact en personeelsbehoefte allemaal op hetzelfde moment zichtbaar, voor dezelfde mensen, op dezelfde dag.
Een Snelle Zelftoets Voor het Volgende Piekseizoen
Vijf vragen die het waard zijn om deze maand aan het team te stellen, terwijl er nog tijd is om naar de antwoorden te handelen:
- Voorspellen we retouren los van het uitgaande volume, per categorie?
- Kan een eenvoudige retour worden goedgekeurd en gelabeld zonder dat een mens eraan te pas komt?
- Is winkeltegoed de standaardoptie die we tonen, of iets waar een klant expliciet om moet vragen?
- Hoeveel dagen zitten er tussen het aankomen van een pakket in het magazijn en het moment dat dat artikel weer als verkoopbaar wordt getoond?
- Kijken operations en finance naar hetzelfde retourdashboard, of naar twee verschillende spreadsheets?
Als meer dan één antwoord het team ongemakkelijk maakt, is dat het startpunt voor het draaiboek, en geen reden om te wachten tot november om het op te lossen.
Hoe Zineps Retouren Behandelt als Infrastructuur, Niet als Bijzaak
Zineps is gebouwd op een simpel uitgangspunt: verzending en retouren moeten draaien op één verbonden operationele laag, niet op een verzameling losse tools die achteraf aan elkaar zijn geplakt. Als operating system voor verzendingen geeft Zineps e-commerce merken één platform om uitgaande verzendingen, retourlabels, vervoerderskeuze en realtime tracking te beheren over elke vervoerder en elke markt heen, zonder tussen systemen te hoeven wisselen zodra het volume piekt.
Specifiek voor retouren automatiseert ons platform het genereren van retourlabels, geeft het klanten een eigen gebrand self-service retourportaal zodat ze nooit een supportticket hoeven te openen voor een standaardretour, en geeft het operationele teams live zicht op waar elk geretourneerd pakket zich bevindt. Wanneer logistieke partners, vervoerders en fulfilmentpartijen allemaal rapporteren binnen hetzelfde systeem, stopt een retourpiek een noodgeval te zijn en wordt het een voorspelde, beheersbare gebeurtenis, precies het resultaat waarvoor het raamwerk hierboven is ontworpen.
De Conclusie
Het piekseizoen eindigt niet in december. Voor de meeste Europese e-commerce merken begint de tweede helft ervan in januari en loopt die door tot ver in de maanden erna, en die helft is vaak duurder per order dan de uitgaande drukte die eraan voorafging. Merken die retouren na de feestdagen behandelen als een geplande operationele gebeurtenis in plaats van een reactieve brandoefening, beschermen consistent meer marge, herstellen voorraad sneller en houden klanten loyaal tijdens wat voor veel shoppers hun allereerste echte contact is met de servicekwaliteit van een merk.
Juli is niet te vroeg om dat plan te bouwen. Als de afgelopen januari een brandoefening was, zijn de maanden tussen nu en de volgende precies het venster om dat op te lossen.
Klaar om te zien hoe een verbonden verzend- en retourplatform de rekensom van het piekseizoen verandert? Bekijk het Zineps retourplatform of neem contact op met ons team om een retourdraaiboek voor de feestdagen van 2026 te bouwen.